Measuring Usability with System Usability Scale (SUS)
There is no doubt about the importance of measuring and tracking user experience. Depending on the specifications of a digital product, different sets of performance metrics may be used to evaluate the user experience, such as time on task, success rate and error rate, conversion rate and issue-based metrics. These metrics are based on quantitative data collected during user testing sessions or contextual interviews, at the very least using product analytics data.
But not all user data comes in numbers. In fact the most valuable information obtained during user interviews is not at all quantitative. So there is a need to translate that data into measurable metrics that can be compared and tracked throughout time.
The System Usability Scale is an attempt to solve this problem.
What is the System Usability Scale (SUS)?
The System Usability Scale (SUS) was introduced by British software engineer John Brooke in 1986.
Mr. Brooke himself describes SUS as a “quick and dirty” tool for assessing the usability of electronic office systems. Although back in 1986 everything was completely different from now this method has lived on and has since been tested on hardware, consumer software, websites, cell-phones, IVRs and even the Yellow Pages. It has proved to be a useful tool in assessing web usability in a relatively easy and reliable way.
SUS method is widely acknowledged by such UX/Usability professionals as Jeff Sauro – the founding principal of MeasuringU, a company providing statistics and usability consulting to Fortune 1000 companies.
“…data shows that SUS is a reliable and valid measure of perceived usability.” – Jeff Sauro
The System Usability Scale has become an industry standard with references in many publications, among which;
“The Factor Structure of the System Usability Scale” – James R. Lewis and Jeff Sauro
“Determining What Individual SUS Scores Mean: Adding an Adjective Rating Scale” – Aaron Bangor, Philip Kortum, James Miller
The System Usability Scale is also included in the training course offered by Nielsen Norman Group “Measuring User Experience” as a quantitative study method. So it may be considered a widely acknowledged usability measurement method on which we can rely.
Using SUS for Usability Measurement
SUS is a Likert-type scale, which is a well-known method for scaling responses in survey/questionnaire research. It is based on forced-choice questions, where a statement is made and the respondent needs to indicate the extent to which they agree or disagree with the statement on a 5 point scale. (Strongly disagree, Disagree, neither agree nor disagree, Agree, Strongly agree).
The good thing about this method;
- It’s a very quick and easy way to analyze user survey data
- SUS can even be applied to small sample sizes and still be reliable and valid.
The bad thing is that SUS score is a bit complex and hard to interpret the right way. But in this article I will try to clear it all up.
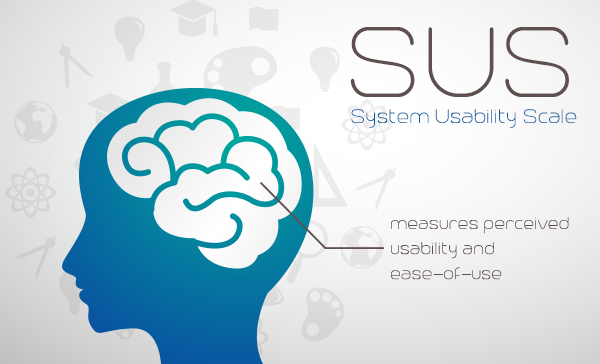
Originally the system usability scale was intended to measure perceived usability and ease-of-use of a system. This means that SUS is a rather subjective metric based on what users thought was good or bad about the system.
The SUS questionnaire is generally used after all respondents have used the system. The whole idea is to record the immediate impression users get without thinking about each statement for a long time. No discussions or debriefings are allowed before filling in the questionnaires in order to eliminate any external influence on the survey outcome.
When using SUS, sample size and reliability are not directly correlated, so SUS can be measured even for as few as two users and still generate reliable results.
Understanding the Questionnaire
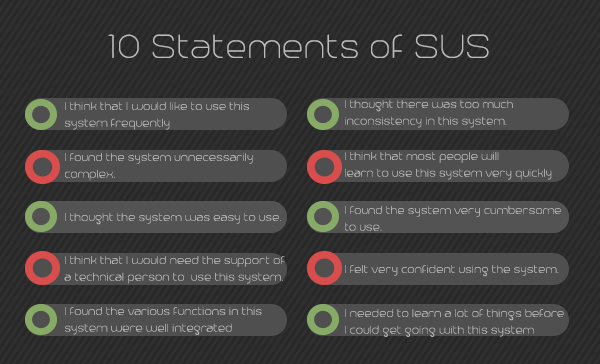
The SUS questionnaire consists of 10 statements that are standard and not subject to change regardless of the system being evaluated. These statements reflect positive and negative ideas about the overall system, the ease-of-use and learnability to which respondents may agree or disagree to a certain extent.
Exactly half of the statements are positive and the other half are negative. The survey includes the following statements:
- I think that I would like to use this system frequently.
- I found the system unnecessarily complex.
- I thought the system was easy to use.
- I think that I would need the support of a technical person to be able to use this system.
- I found the various functions in this system were well integrated.
- I thought there was too much inconsistency in this system.
- I would imagine that most people would learn to use this system very quickly.
- I found the system very cumbersome to use.
- I felt very confident using the system.
- I needed to learn a lot of things before I could get going with this system.
Participants indicate a level of agreement on a 5 point scale, where “Strongly disagree” is scored as 1 and “Strongly Agree” is scored as 5.
How to Calculate SUS Score?
In order to calculate the SUS score, we first of all need to calculate the score for each of the 10 statements. Since the statements in the survey are half negative, half positive, we need to somehow scale them down to one dimension, so that the higher SUS score the better.
To do so we calculate individual scores for each statement the following way;
- For odd items (statements #1, #3, #5, #7, #9): subtract 1 from the user response.
These are the positive points. - For even-numbered items (statements #2, #4, #6, #8, #10): subtract the user responses from 5.
These are the negative ones.
This way, all responses are scaled to 0-4, where 0 is the most negative and 4 is the most positive response.
Add up the converted responses for each user and multiply that total by 2.5. This converts the range of possible values from 0 to 100 instead of from 0 to 40. It’s just a more convenient way to look at the numbers.
An important thing to remember is that although the scores are 0-100, these are not percentages and should be considered only in terms of their percentile ranking.
What is Considered a Good SUS Score?
When you analyze the survey results and come up with a score the first thing you want to know is how good or bad it is. Well, it would be best to have some benchmarking data to compare with, or an industry average for your particular product type.
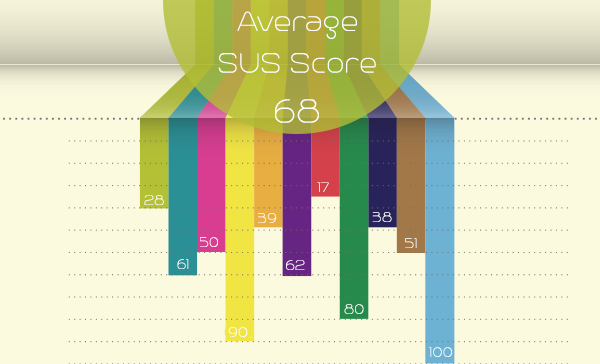
If somehow you are the first to use this method and have nothing to compare with, you can make use of the average SUS score based on 3,500 surveys within 273 studies conducted during the previous 10 years. According to these studies the average SUS score is 68 out of 100.
An SUS score above 68 would be considered above average and anything below 68 is below average.
While it is theoretically correct to say that an SUS score of 70 out of 100 represents 70% of the possible maximum score, it actually is closer to the average (score of 68), so it is more appropriate to refer to it as 50%.
Final Thoughts
Measuring user experience is not an easy task, as it’s all about what users think and feel. So the system usability scale can come in really handy when trying to quantify this kind of qualitative information. And just like any other performance metric, the more data you have the clearer picture you will see in a dynamic view.